Outline
Main menu
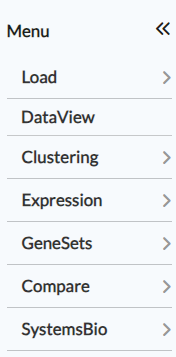
Using the main menu on top, you can navigate through the different analysis modules. Generally you want to start from top to bottom, from specific gene-wise to the more higher-level functional analysis modules. Some users prefer the other way around.
By default, the following menu items are present, namely Load, Data View, Clustering, Expression, GeneSets, Compare and SystemsBio.
Help menu
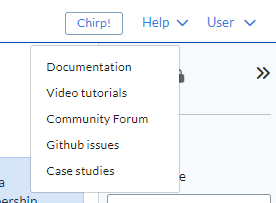
The Help menu is located on the top right hand corner. The menu links to the online platform documentation (the page you are currently viewing), a collection of video tutorials on youtube, the community forum of the platform, the Github webpage, where busg can be reported, and a collection of case studies based on Omics Playground.
User menu
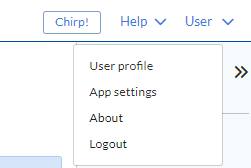
The User menu is located on the top right hand corner, right next to the Help menu. It links to the user profile, where information on the usage of the platform can be found, the app settings, the “About” pop-up that shows information about the version of the platform currently deployed and finally the “Logout” option to disconnect from the platform.
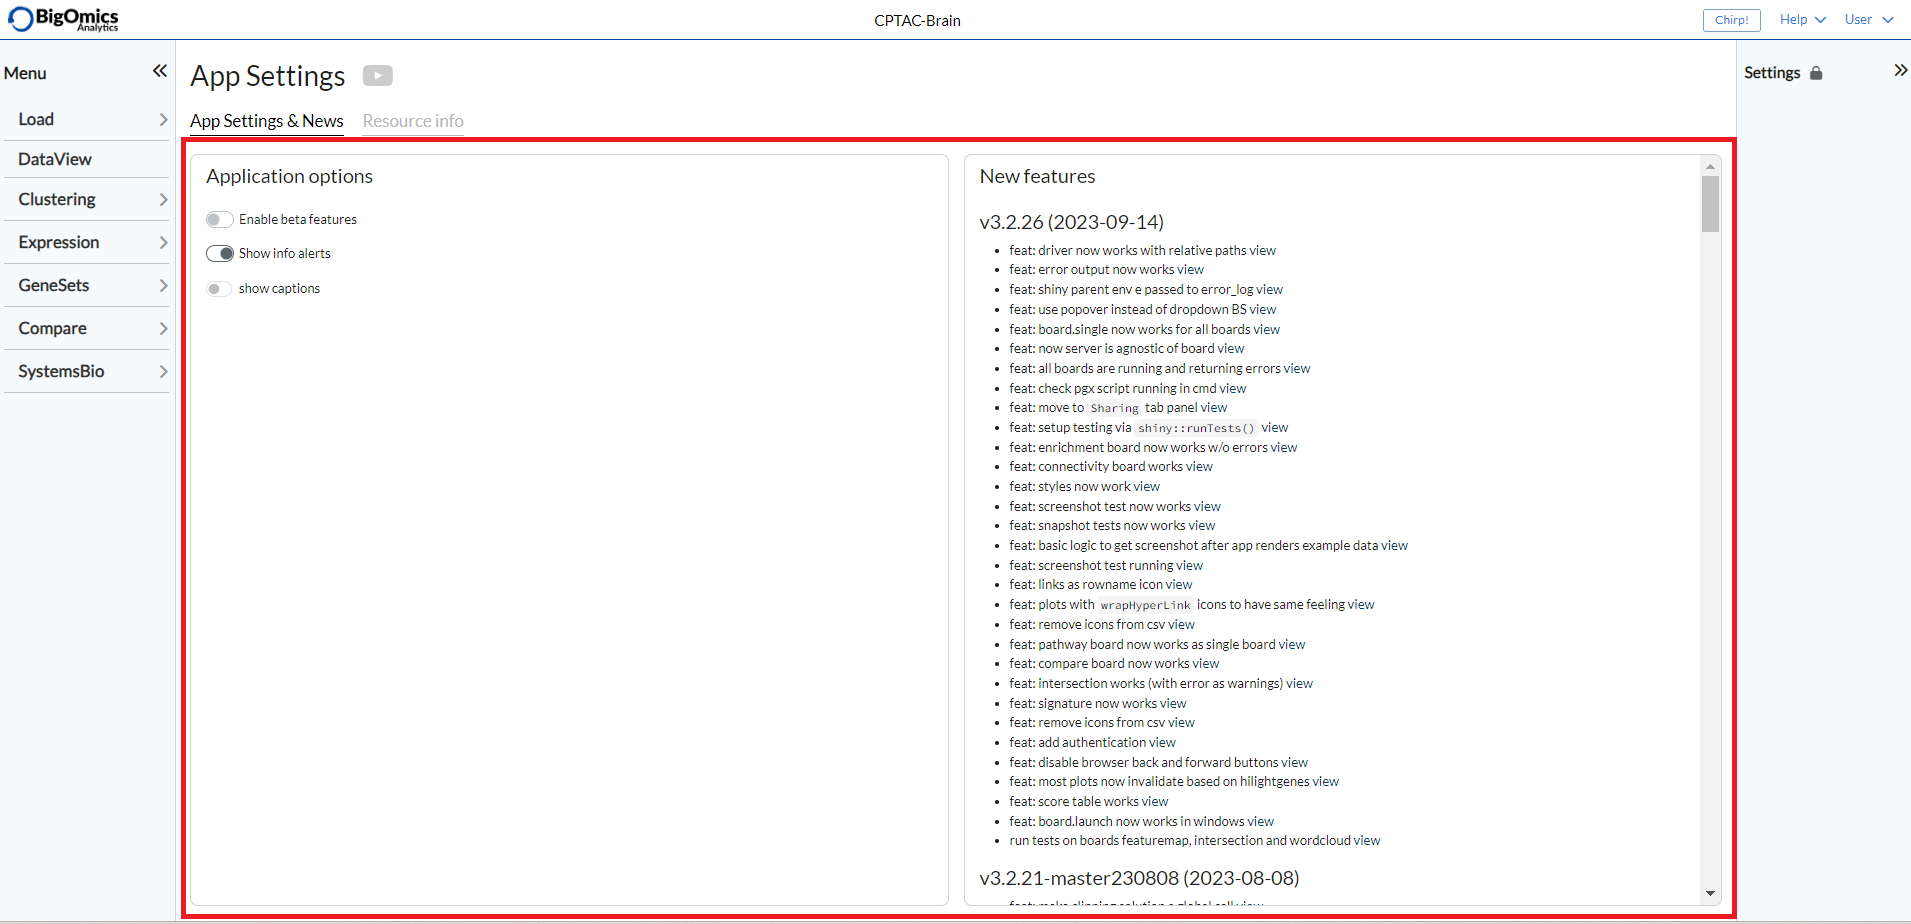
Clicking “App settings” will take the user to a new page with two tabs: App settings & News and Resource info.
There are two panels under the App settings & News tab: Application options and New features.
- Application options:
Through this panel, users can enable beta features, disable alerts and enable captions for the plots.
- New features:
This panel provides a list of new features implemented with each new update of the platform.
Three panels are found under Resource info: Timings, PGX slot sizes and R object sizes.
- Timings:
The timings table reports more detailed information about the object dimensions, object sizes and execution times of the methods.
- PGX slot sizes:
This table provides details about the pgx object.
- R object sizes:
This table provides size details about R objects.
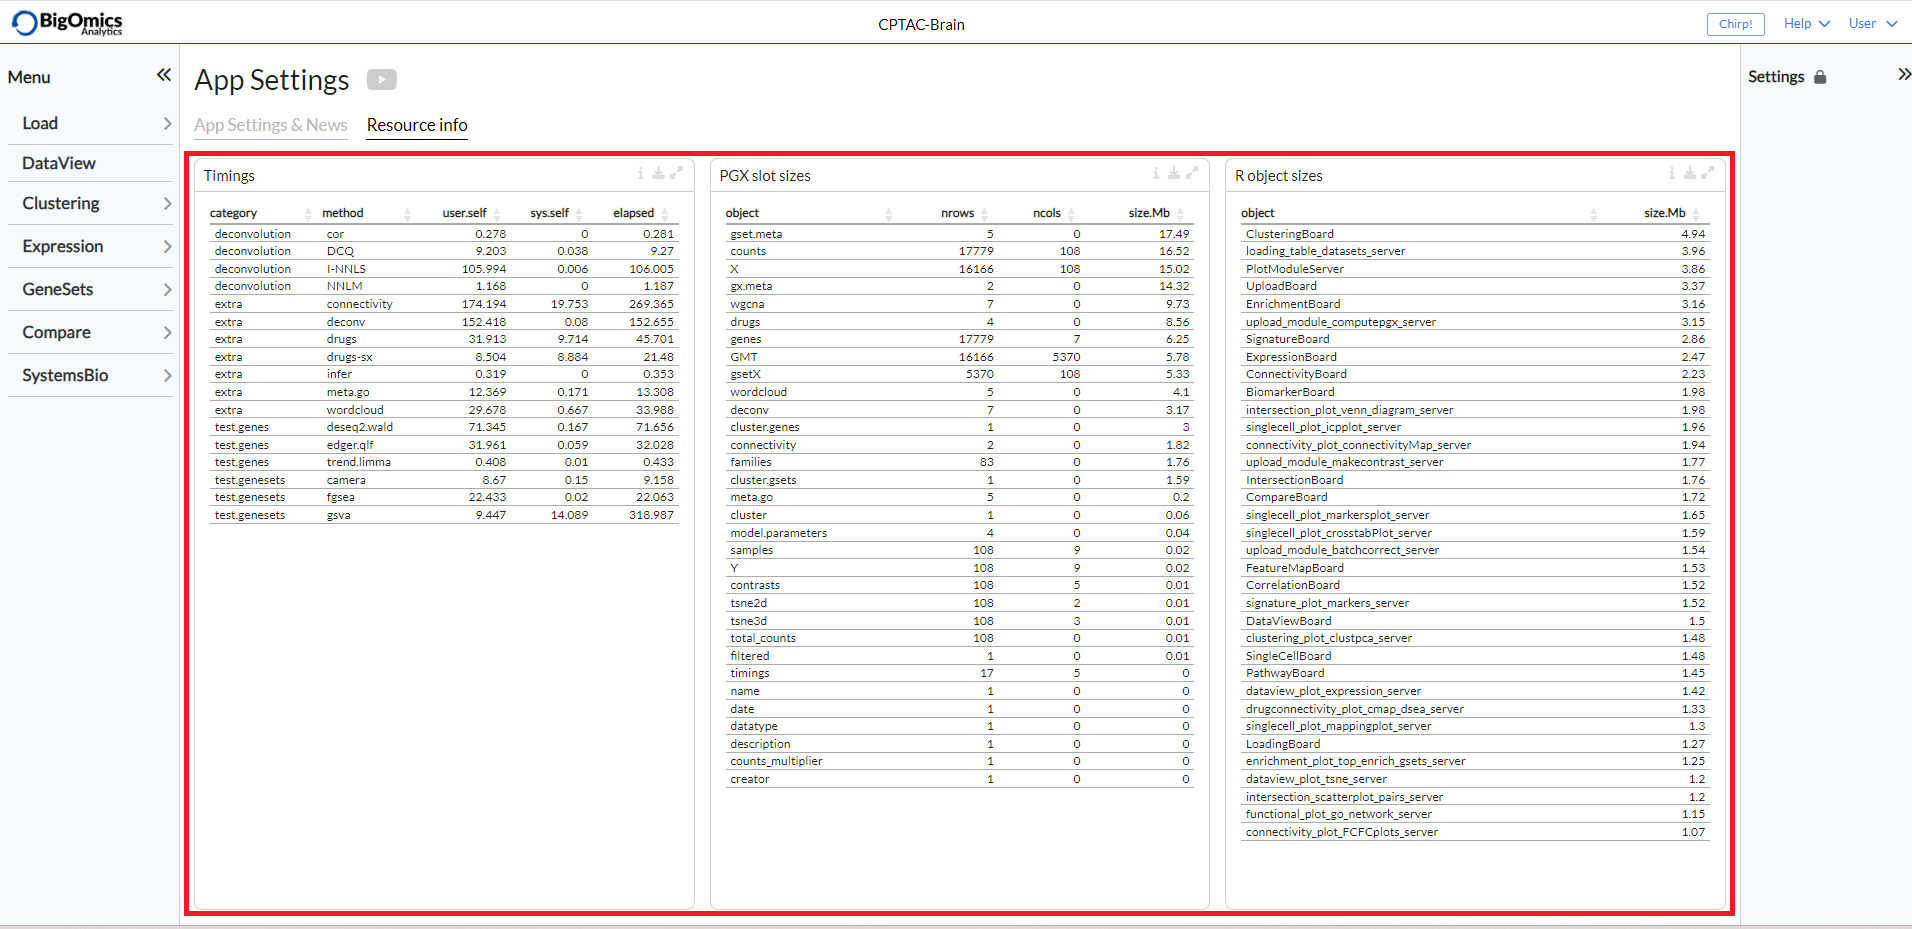
Figure & table tags
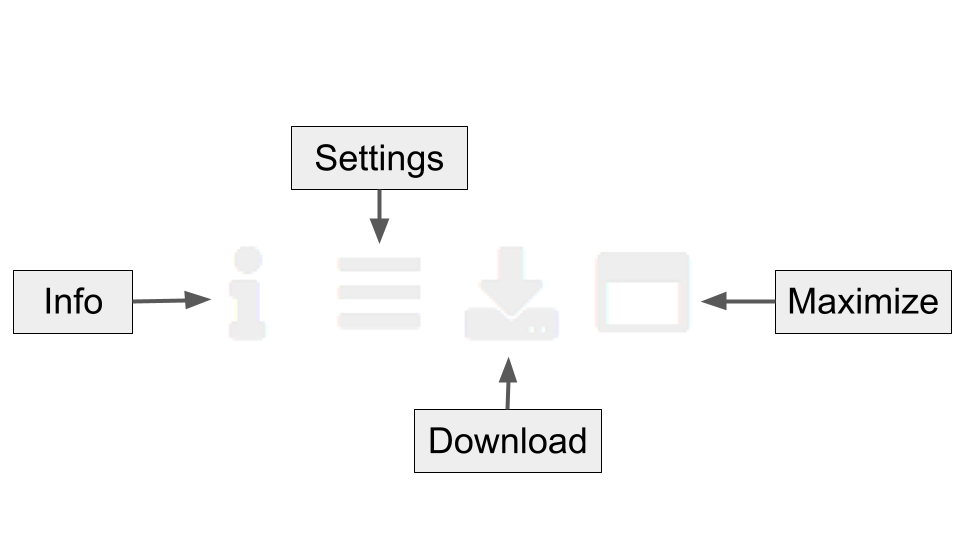
Each figure or table on the platform is assigned the following interactive buttons, where:
Info: provides detailed information about the figure or table.
Settings: users can specify additional settings if applicable.
Download: downloads a figure as a PNG or PDF file or a table in CSV format.
Maximize: shows a larger version of a figure in a separate window.
Glossary
Signature: a list of selected genes (e.g. by significance or fold change),
Condition: a specific phenotype group (e.g. tumor or control),
Contrast: a comparison between two conditions (e.g. tumor vs control),
Profile: a vector of fold changes corresponding to a certain comparison,
Hierarchical clustering: a method that groups similar samples into groups,
Q value: an FDR-adjusted p value,
Biomarker: a biological feature (gene, mutation or gene set) that characterises a specific physiological or pathological process.