Load Panel
Selecting a dataset
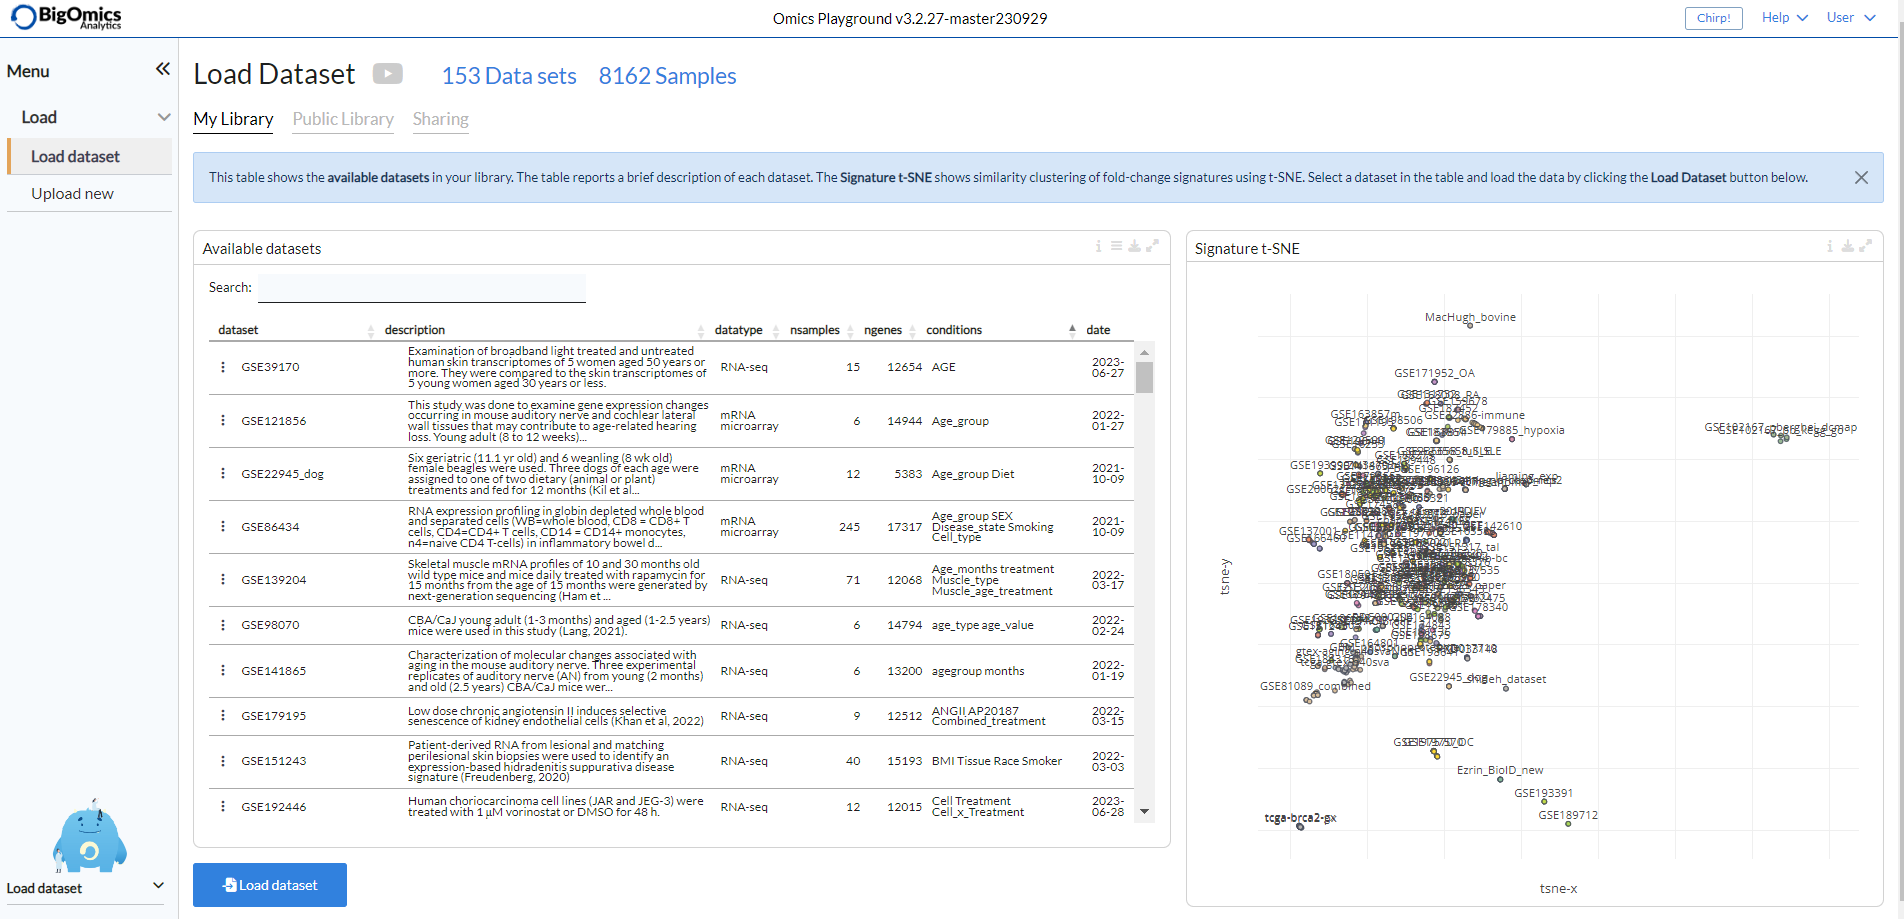
The Load panel panel shows the available datasets within the platform. Each dataset contains a brief description as well as the total number of samples, genes, corresponding phenotypes and the collection date.
Users can select a dataset in the table and then click on the “Load dataset” button at the bottom left to load a dataset into the platform. On the right hand side a signature t-SNE plot is displayed . Each dot corresponds to a specific comparison. Signatures/datasets that are clustered closer together, are more similar.
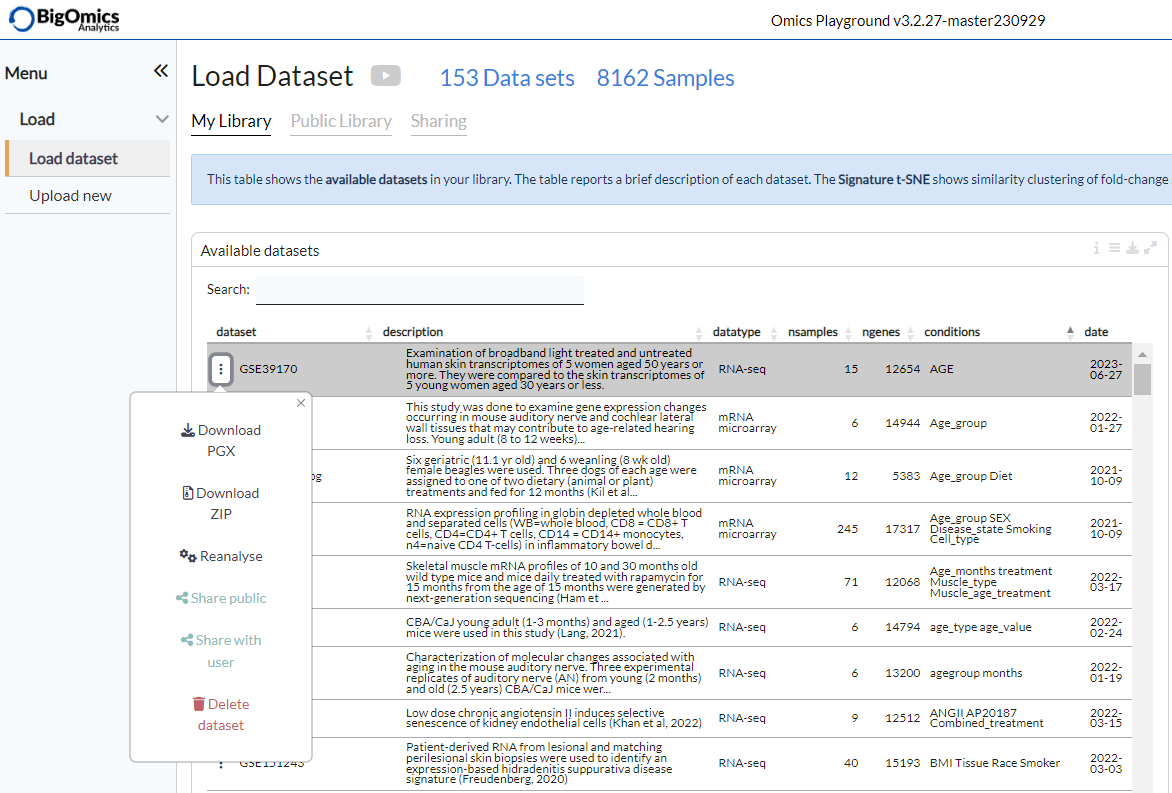
A pop-up menu is displayed when clicking on the three dots next toa dataset name. From this menu, users can download either a pgx object, which contains all the calculations and plots, or the raw input data that was used to generate the dataset. The “Reanalyse” option is used to perform a new analysis based on the same input files as the selected dataset. Users can also share a dataset with another user ( via the “Share with user” option) or make a dataset public (via the “Share public” option). Finally, “Delete dataset” is used to remove a dataset permanently from the platform.
N.B. Some of these features are (such as the delete option) are not available on trial accounts.
Load (Upload new)
Under the Upload new option of the Load panel users can upload their transcriptomics and proteomics data to the platform. The platform requires three data files as listed below: a data file containing counts/expression (counts.csv), a sample information file (samples.csv) and an optional file specifying the statistical comparisons as contrasts (contrasts.csv). The file format must be comma-separated-values (CSV) text. Be sure the gene names match for all files. On the left side of the panel, users need to provide a unique name and brief description for the dataset while uploading.
- counts.csv:
Count/expression file with gene on rows, samples as columns.
- samples.csv:
Samples file with samples on rows, phenotypes as columns.
- contrasts.csv:
Contrast file with conditions on rows, contrasts as columns.
Once uploaded, the platform generates three separate plots showing some stastics and the structure of your input files.
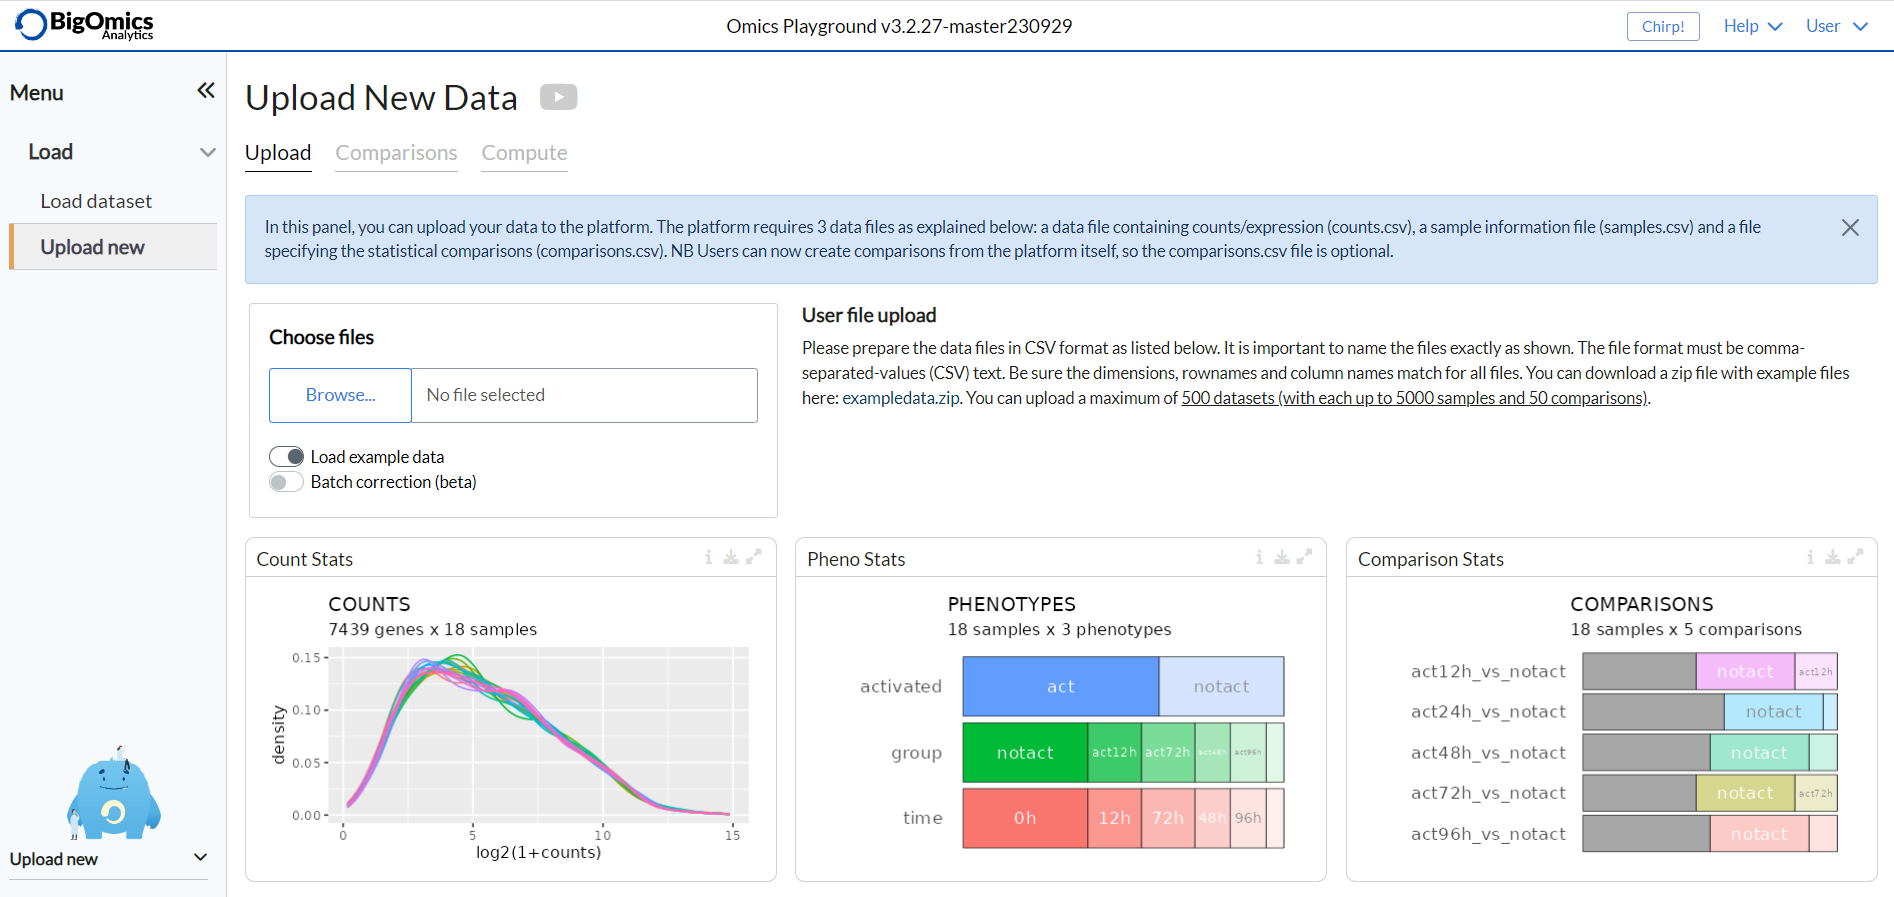
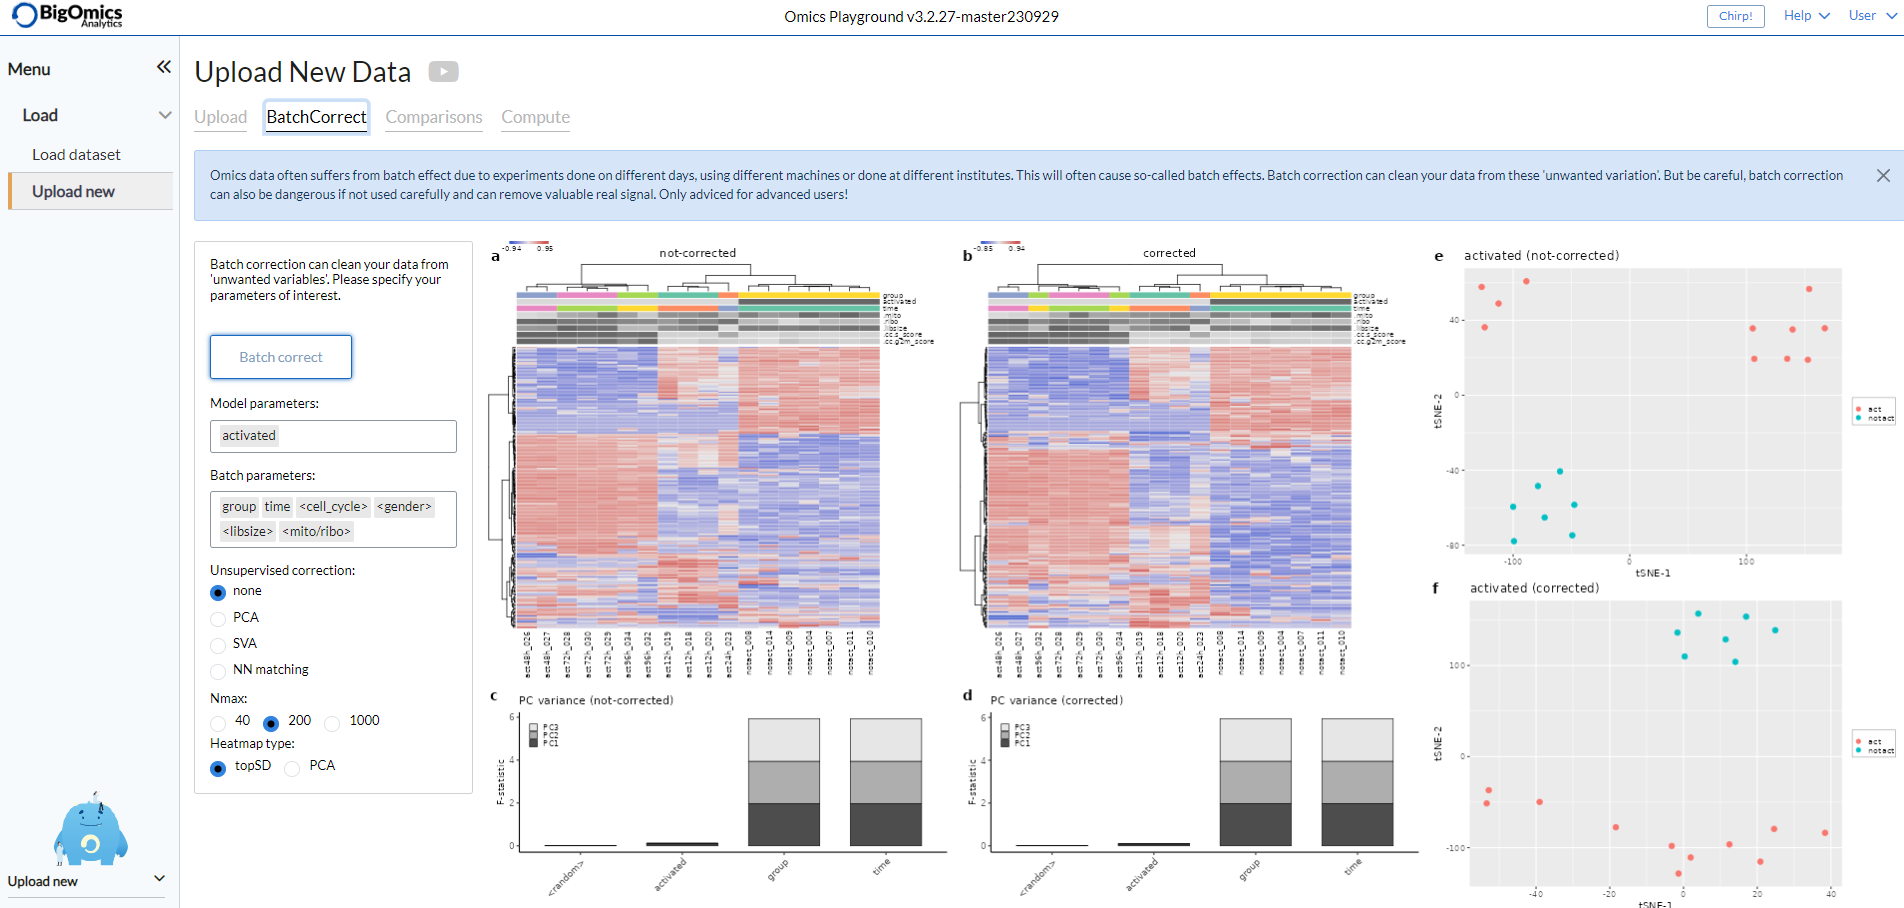
The page also contains a batch correction option that allows users to perform batch correction on the data. Selecting it will open a new panel from which users can select the level of batch correction (low, medium or strong). Under Advanced users can fine-tune the process. This feature is still in beta and only recommended to users familiar with the batch correction precedure and parameters. More information can be found under Methods.
Upload new (Comparisons)
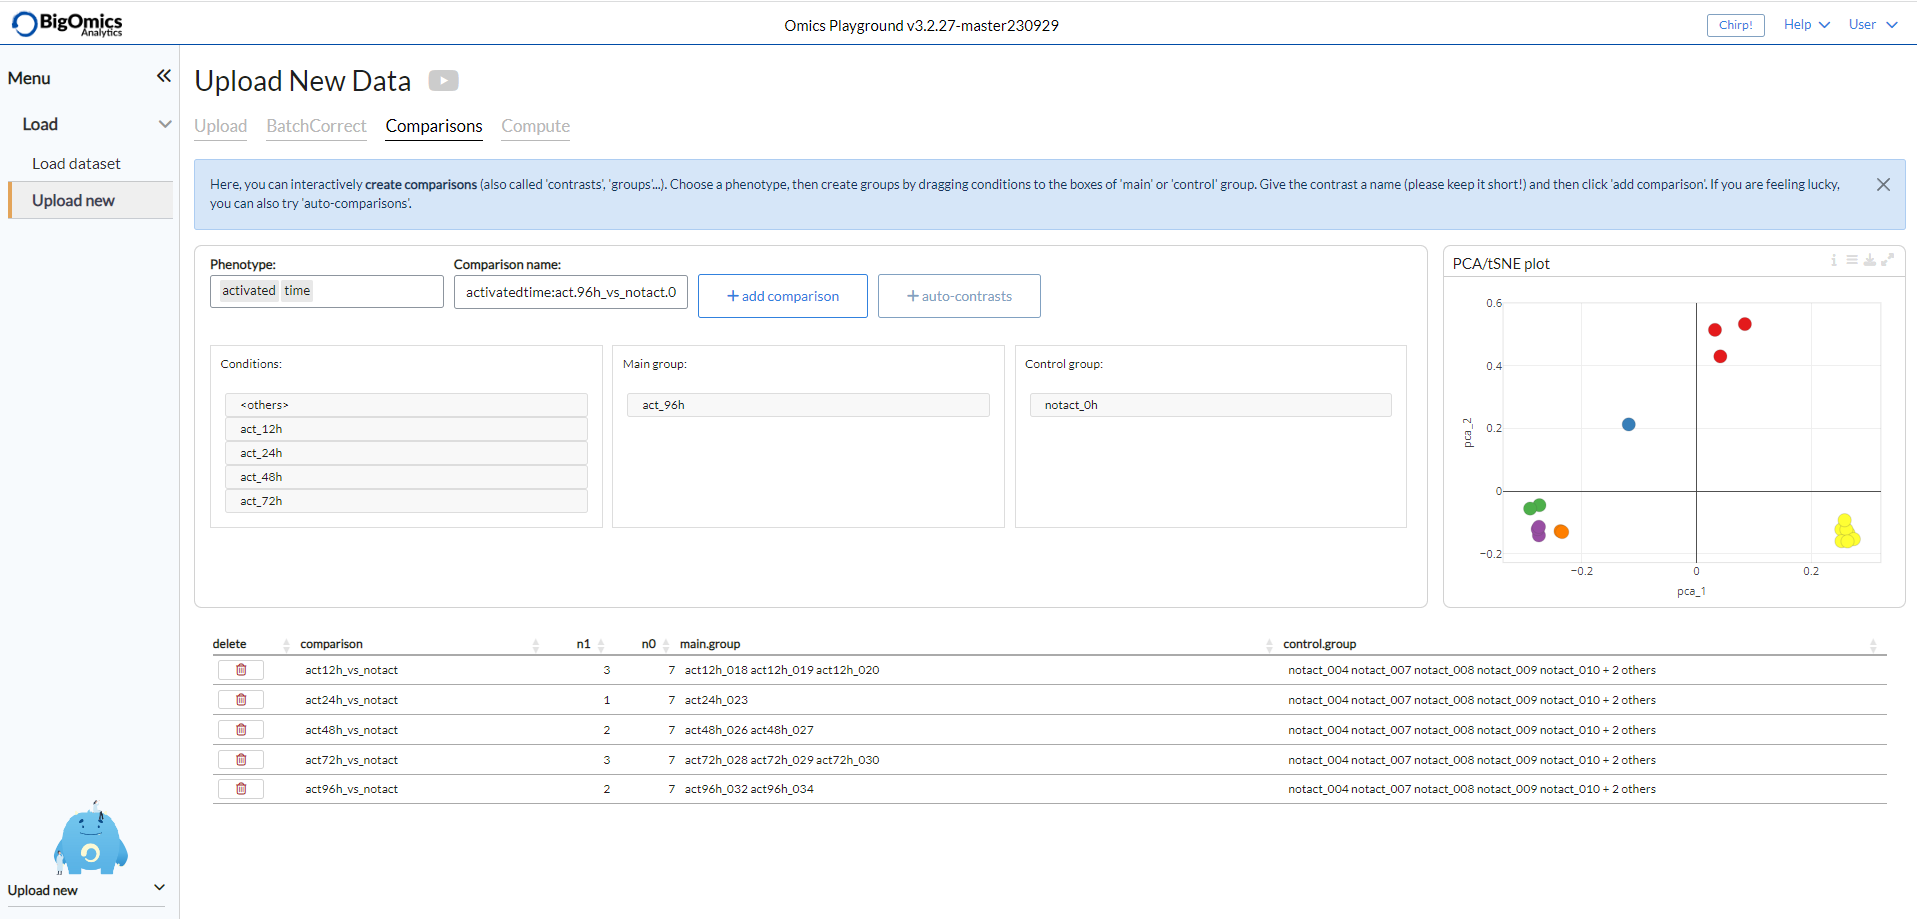
Users can eschew adding a contrast file and instead generate contrasts via the Comparisons subpanel of the Upload new panel. Available phenotypes will appear in the “Phenotypes” box as a scrolldown menu. Selecting a phenotype will show the available conditions in the “Conditions” box. Users can then drag individual groups in the “Main group” or “Control Group” boxes. It is also possible to select individual samples from the “Conditions” box and phenotypes can be furthermore combined in the “Phenotypes” box. The platform automatically generates a contrast name in the “Comparison name” box that users can manually edit. Clicking the “add comparison” button will add the selected contrast in the contrast table below. Users can also task the platform to generate comparisons automatically by selecting a phenotype form the “Strata” box and clicking on “add auto-contrasts”. However, we recommend caution when using this function as it is error-prone. The panel also produces a PCA/tSNE plot that users can consult as a guide for generating comparisons.
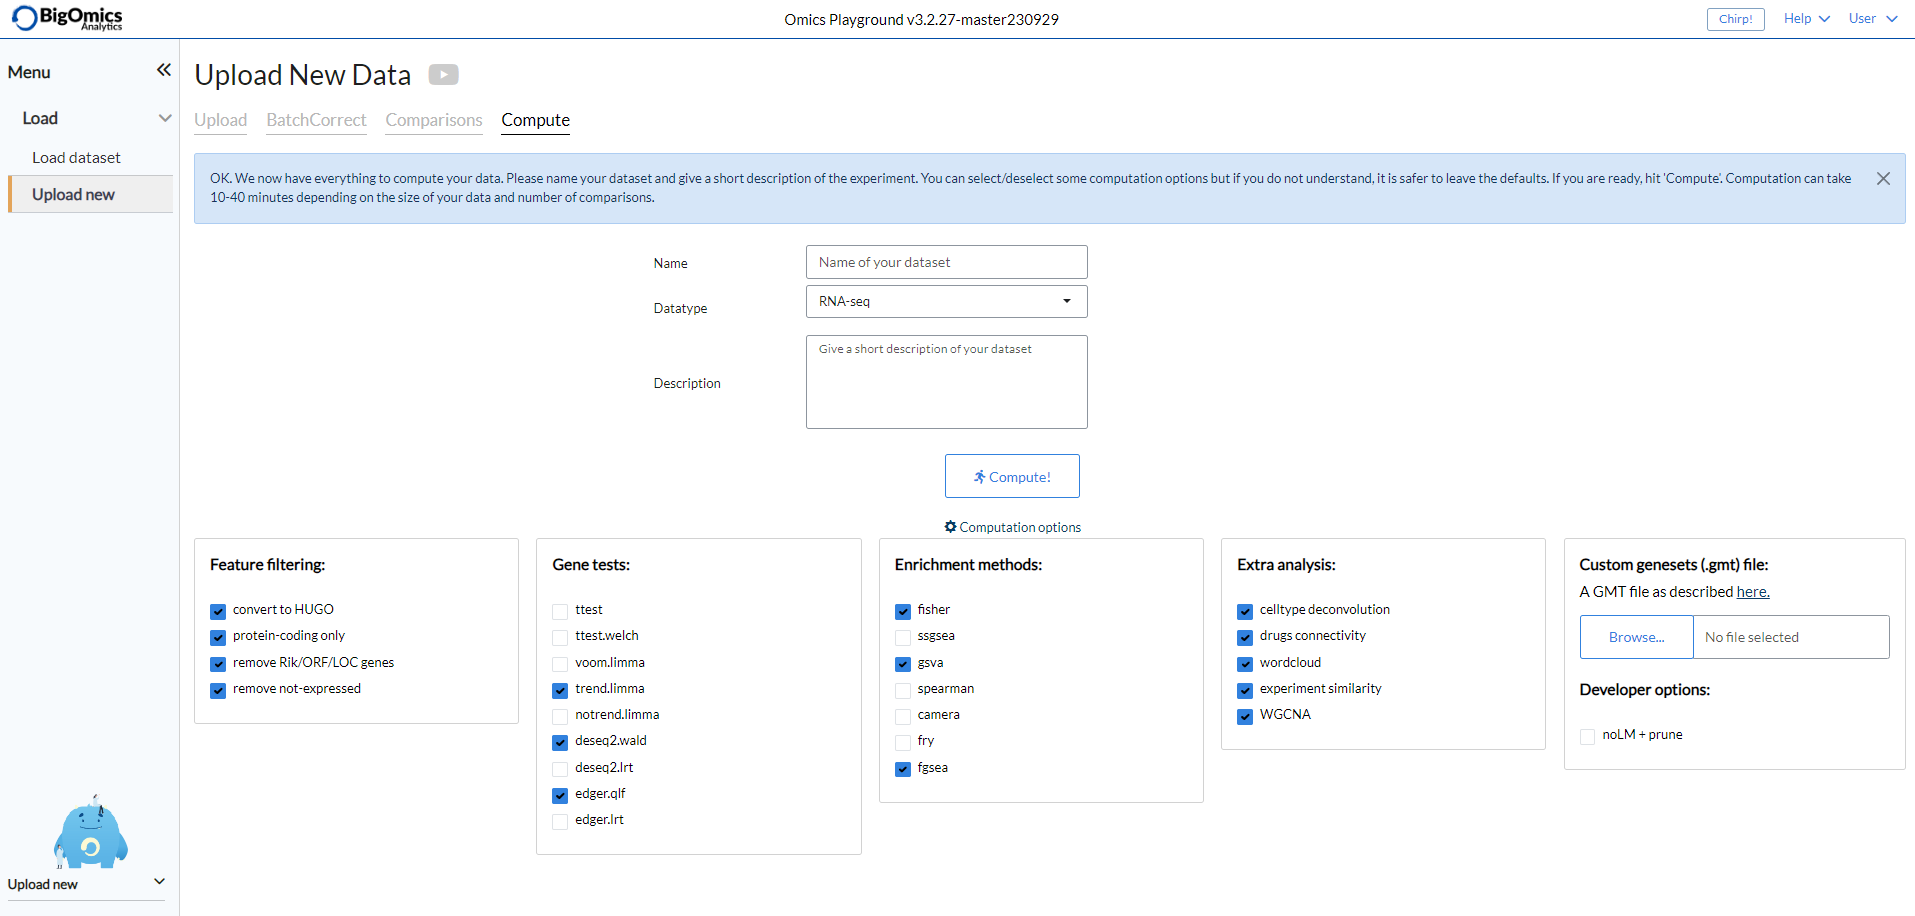
Upload new (Compute)
The Compute subpanel is where users can start the computation of their data. They need to provide a unique name for the dataset, indicate the type of data and provide a short description. Beginners can then click on the “Compute!” button and let the platform run the calculations. Advanced users can click on “Advanced” to access several customisation options. In particular they can de-select feature filtering options, select different gene tests and enrichment methods combinations, include or exclude analysis types and select developer-specific options. A new advanced feature with V3 of the platform is the ability to upload a custom GMT files with a dataset.